Additional information on step 6: Explaining scoring to service users and providers; choosing a scoring method
Check the literacy levels in each group and adapt the method of scoring to suit the literacy levels as well as the community’s understanding of what scoring is.
NOTE: Make sure that the community does not view the service provider as a child that needs to be awarded a mark (despite this being used to illustrate the “percentage” technique of scoring outlined below), as this can lead to the service providers being undermined by the community and even mocked. Also, explain the implications of the scores.
Examples of scoring techniques
On a scale of 0% to 100%
This works the same as a teacher giving a mark at school for a pupil’s test or exam. 50% is a pass, but anything below 50% is a fail and the lower the score goes down, the worse the service is. If however the work is such that it is more than just a pass, then the score will be above 50%: anything from 51% to 100%. The higher the mark given, the better the service is. This technique is preferred because most villagers can associate it with how their children are given grades at school with 50% being the average score and it is easier for them to understand and negotiate and increase or reduce scores according to their discussions.
On a scale of 1 to 10
In this technique, the lower the score (1–4), the worst the service or project is; the higher the score (6–10), the better the service or project is. “5” is the middle point of a range of 1 to 10. That would imply a position of in the middle, therefore, a medium score. This technique will require slightly higher analytical skills; for most villagers to grasp the concept of a 1–10 scale is difficult as they still see the numbers as too small to represent the kind of successes they see. They may want to go beyond the mark of 10 to emphasise their point.
The following two techniques are helpful for when the group is low literate or illiterate.
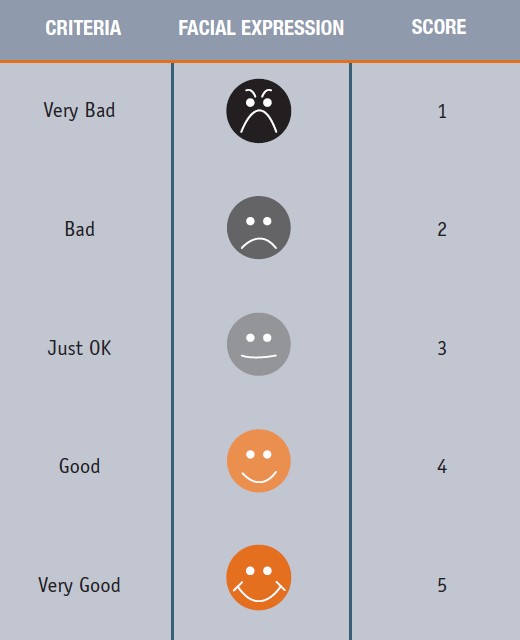
Using faces to show feelings
Ask the group to choose a face (see diagram) that shows how they feel about the various indicators (Thindwa et al, 2005). This technique is simple and straight forward but it might not be able to represent the gravity of the issues as compared to scoring with numbers on a scale of 0% to 100%. It does not allow the community to express the situations found in between each pair of two faces.
Using example of holes in the ground
Communities know about holes/pits in the ground – and that they can be a problem because children or animals can fall in and hurt themselves or get killed. Each issue (now made into an indicator) can be seen as an open pit. Some pits can be bigger or deeper than others; the bigger (size) and deeper (depth) the pit, the more serious the problem. The objective of the Score Card process is to fill all the open pits and thereby reduce the problems. The group should assign a size and depth to each indicator by answering the following question: From 1 to 10, how many pails or buckets of soil will you need to fill this pit to make it level with the ground? The more pails, the bigger and deeper the pit is and therefore, the bigger and more serious the problem is. Alternatively, using the same pit analogy, tell them that to be able to get out of the pit, a ladder will be required. The guiding question is then: How many steps (from 1–10) would there need to be on a ladder for you to get out of the pit?
Record to remember – It is important to show in your report and on your Score Card matrices which method was used since 1 pail required means it is not a big problem where a score of 1 (on a scale of 1 to 10) implies the lowest score, and therefore a very big problem.
These techniques require the facilitator to be very focused and able to explain clearly the analogy in order for the community members to understand and give correct scores representing the situation.
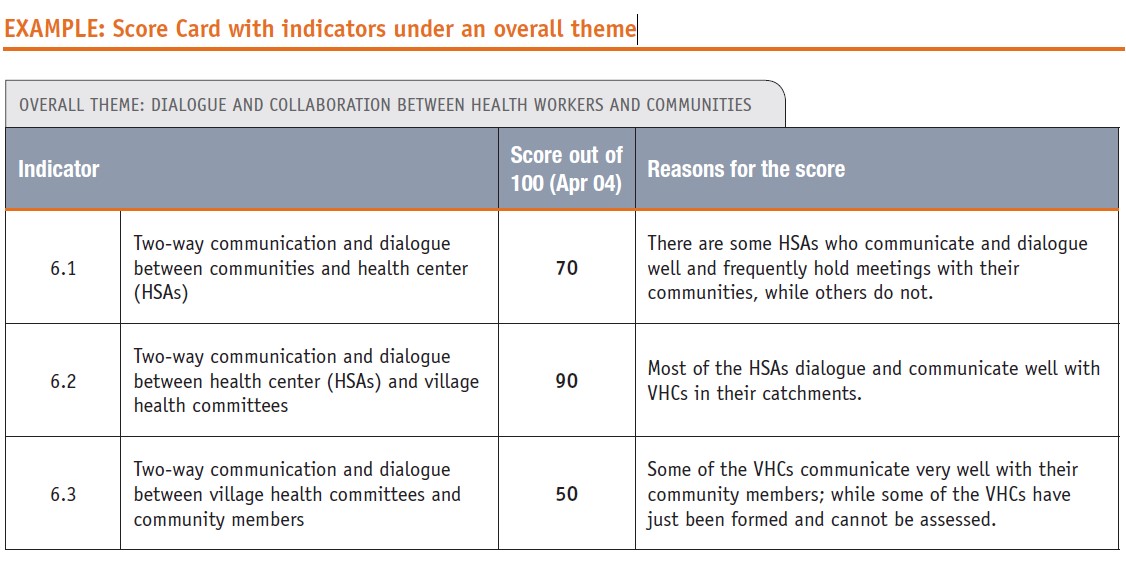
Once the scoring method has been chosen, ask the group to give each indicator a score using the agreed upon scoring method. Make sure that the score includes everyone’s view and that everyone has agreed upon the score. Include the reasons for the score that is chosen.